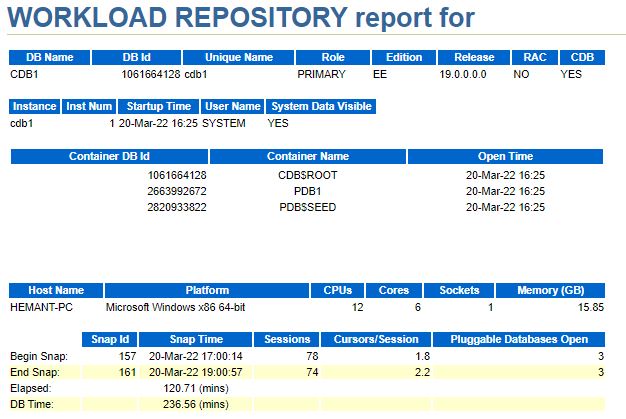
I have covered AWR Reports (from 10g to 12c, including MultiTenant) in the past. You could search for "AWR" in the "Search this Blog" in the panel on the right or by specifying :
site://hemantoracledba.blogspot.com AWR
in the Google Search Window
So, I have an AWR Report for 19c on Windows for a duration of 120minutes with 12 CPUs. That is a total of 86,400 available CPU seconds (120minutes X 12 CPUs X 60seconds_per_minute)
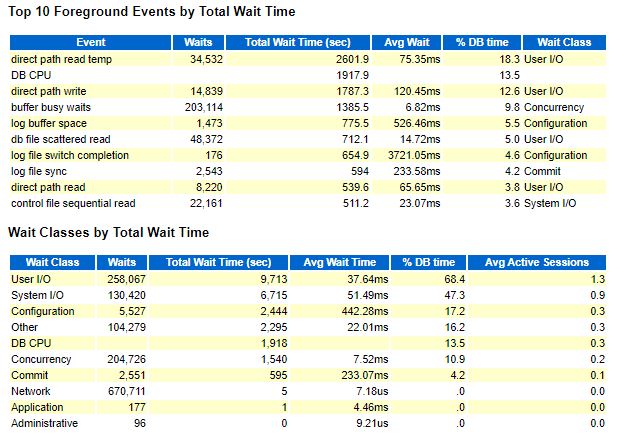
The Load Profile shows 0.4 Oracle CPU seconds per Elapsed Seconds. This means that, on average, I am consuming less than 1 CPU.
Note very carefully that this does NOT mean that the Oracle Database Processes account for 13.5% of Server CPU Usage.
This also translates about 9% of the total actual CPU "busyness" on the Server.
So, if Oracle consumed only 9% of the actual CPU Usage on the server, I would need to look for other processes on the same server that would have been consuming CPU.
This could be other Oracle Database Instances (my report is for database instance "CDB1" -- was there / were there one or more other Database Instances active on the same server ?). This could also be non-Oracle programs, Application Server software, other system / monitoring tools running (I've seen monitoring tools alone consuming 20% of the CPU on a server !).
If this server is hosting only this 1 Database Instance (CDB1), it is excessively provisioned (12 CPUs) for the actual load. Of course, the load that I have generated here is I/O intensive, but it means that I could have actually reduced the number of CPUs to, say, 4 CPUs and paid much less in Hardware, Oracle Licensing and Oracle Support costs. (4 CPUs would have allowed for the OS and the other non-Oracle processes that seem to be accounting for 24% user-time of 12 CPUs).


2 comments:
Excellent post!
Excellent explanation. Thanks for sharing valuable knowledge.
Post a Comment