15 April, 2022

A Fresh Look at AWR Reports --- 4 : SQL*Net Waits

 After the first three posts on CPU Usage, Redo Size and I/O Profile, I present my interpretation of SQL*Net waits.

From the same AWR Report as the first three reviews, I have extracted the specific SQL*Net waits from the Foreground Wait Events table:
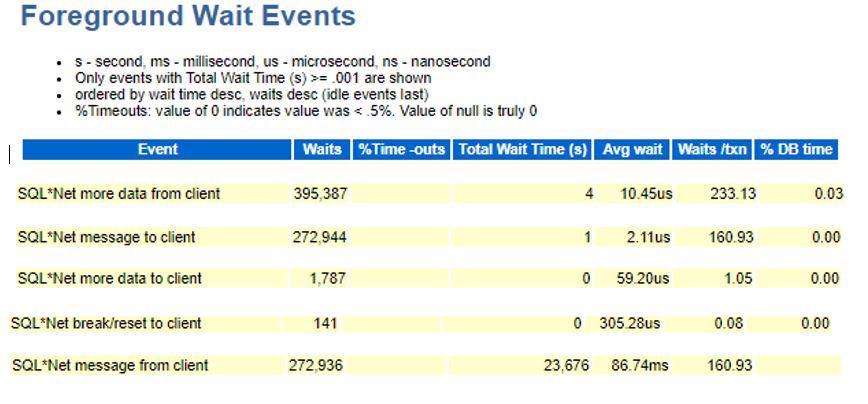
SQL*Net Waits from the Foreground Waits Table

"SQL*Net more data from client" waits occur when the server process hasn't received the required data (e.g. an INSERT statement data) within 1 network packet and has to wait to receive more more.  "SQL*Net more data to client" is the reverse -- the client has requested, say a large row or dataset that doesn't fit into 1 network packet.  The network packet size is determined essentially by two parameters "Session Data Unit" (aka "SDU") and "Transport Data Unit" (aka "TDU").  When sending rows out of the server, it can automatically also do compression also. ARRAYSIZE (or Fetch Size, depending on your client code, in java) can also achieve some compression. TDU is obsolete in all recent versions but SDU can still be tuned.  For guidance on tuning SDU,  section 14.2 of the Tuning Guide.

"SQL*Net message to client" doesn't really show time taken to send the message (e.g. sql select statement result or execution of commit) to the client.  It is actually the time taken by the Server Process to put the results on to the Network Layer on the DB Server.  Beyond that, the Oracle Server Process does *not* how long it takes for the data to reach the client (whether a user desktop or an application server / middle-tier).  The actual time would depend on network latency and bandwidth.  So, you can interpret the number of occurrences of the Wait Event but NOT the time.

"SQL*Net break/reset" would be presented when an error occurs or an unhandled exception is raised. A high number of such waits indicate repeated occurrences of errors in SQL calls.

"SQL*Net message from client" may or may not be a problem (and that is why Oracle does not include it in % DB time).  There are different manifestations of this event :

1. The database server has sent a row or a set of rows (depending on arraysize or fetchsize) and is waiting for the client / application server to acknowledge and request the next set of rows.  The client could be a user who is running, say, SQL*Developer, and has seen the first 50 rows of a 1000 row result set but has walked away from his desk to get some coffee and has not yet requested the next set of 50 rows. (Yes, it is true that SQL*Developer and most clients do NOT fetch and present all the rows to the user immediately, this is is done in batches -- the parameter is configurable in most client or java programs).  The user may come back 5minutes or 30minutes later and ask for the next 50 rows.  Till then, the Oracle Server Process is "waiting" on this event.

2. It could also be an application server / middle tier that is formatting / sorting the rows or is writing the results to disk or is joining this set of rows with another data set (even from another source -- e.g. an ODBC connection, an Excel file etc) and is taking some milliseconds to do so.  Till then, the Oracle Server Process may be "waiting" on this event.

3. The database server has sent the results of a query (or success of execution of a DML) to the client / application server and is waiting for the next SQL call.  The next SQL call could be a COMMIT (or ROLLBACK) or any INSERT/UPDATE/DML statement.  It may come 1second later or it may come 30minutes later or it may come 10hours later.  As long as the client / application server has maintained a session on the Database, the Oracle Server Process will be "waiting" on this event.


Other than the above set of "Wait" Events relating to a client / application server, there may occur exactly the same Events relating to a Database Link. :  "SQL*Net more data from/to dblink",  "SQL*Net message from/to dblink" and SQL*Net break/reset to dblink".  They don't appear in my AWR because my example load does not include Database Links to / from other databases.  But you need to interpret them as well.  For example, if you have Database Links for periodic refresh's of Materialized Views between Databases, you may well see such "SQL*Net message" and "SQL*Net more data" waits relating to "dblink"s.

02 April, 2022

A Fresh Look at AWR Reports -- 3 : I/O Profile

 After viewing CPU Usage and Redo Size statistics, here's a look at the I/O Profile.

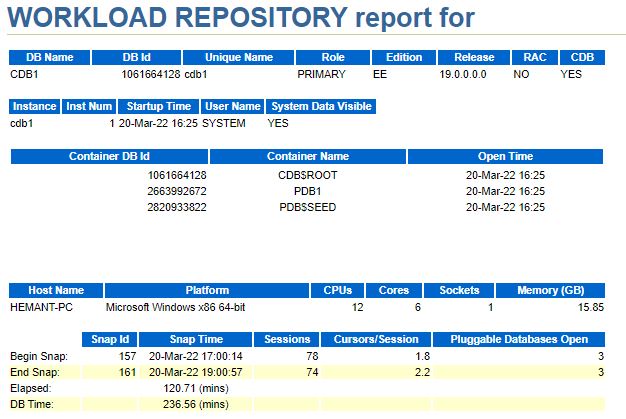
Here's the header which indicates that this AWR report is for duration of 2hours on 19c on Windows :

AWR Header


Instead of the Load Profile, this time I will skip directly to the I/O Profile section :

I/O Profile

In the above table, "Database" seems to include both "Datafile" and "Tempfile".

Also, for some co-relation, the IOStat section :

IOStat by Filetype Summary

As I've already mentioned in my previous 2 posts, the load I that I generated was more I/O Intensive than CPU Intensive.
Here we can see a break-down of the I/O Profile.  I am more interested in the *Writes*.

From the previous post, we've already seen that 20GB of writes were for Duplexed Online Redo Logs and 10GB for ArchiveLogs.
But what about the rate per second ?

Online Redo Log file writes were 2.7MB/second.

Datafile + Tempfile writes were 3.3MB/second.  Note that Tempfile I/O was higher than Datafile I/O.

Although Datafile requests per second were higher, Datafile writes by DBWR may well be in smaller batches (i.e. fewer blocks at each write) --- more I/O calls (85.59), less total written bytes (1.388M).  This is in the nature of DBWR behaviour as DBWR periodically "collects" dirty buffers to flush to disk.

Writes to Tempfile for Sort/GroupBy operations (10.59 for 1.89M) can be more blocks per call.  This is because such operations can consist of large number of blocks in each sesssion. The writes are from PGA, not the Buffer Cache in the SGA.

So, what could have been happening here, that Tempfile writes were so high, relative to Datafile writes ?  Sort Operations, Group By Queries, Create / Rebuild Index operations.

Note : Create / Rebuild operations are unlikely to be all visible in the SQL Statements section of the AWR report because, as DDL statements, they get invalidated and aged out of the Shared Pool quickly before each AWR Snapshot run.  Yet, their I/O profile is visible in the IO Sections of the AWR Report).
Create/Rebuild Index operations do not generate Redo for their Tempfile writes but *do* generate Redo for their Datafile writes if they are not executed as NoLogging operations.


23 March, 2022

A Fresh Look at AWR Reports -- 2 : Redo Size

 In my previous blog post, I showed how to interpret CPU Usage from an AWR report.

Here, I take the same 2hour AWR report and help interpret Redo Size -- ie. volume of Redo Generated and Written to Disk.

Here's the header which indicates that this AWR report is for duration of 2hours on 19c on Windows :

AWR Header


These are the first few lines of the Load Profile :

First few lines of Load Profile

This indicates that the Redo Size (total Redo Generated) is just about 10GB  (multiply Redo Size bytes per Second by the total elapsed seconds (120.71) minutes)

I can confirm that from the Key Instance Activity Stats section :

Instance Activity Statistics

So, did my database write about 10GB (about 9.8GB actually, if you divide by 1024s) of Redo to disk ?   Is that true ?

Let me go to the IOStat(s) section.  (Please ignore the "average service time" in this table because I've run this test on a PC with a standard Hard-Disk -- not an Enterprise SAN !)

IO Statistics by FileType

What do I see here ?  The total volume written to Log Files (i.e. Online Redo Logs) is 19GB !

Why is that so ?

Because, in my database, every Redo Log Group is duplexed -- it has 2 members.  So, Redo of approximately 9.8GB actually translates to 19GB (or close to 20GB) of Physical Writes to Online Redo Log files.

Note that there are 10GB of Reads from  the Online Redo Log files.  That is the Log Archiver Process(es) writing out the Online Redo Logs to the Archive Logs -- which you can see is 10GB of Writes to Archive Log !

Thus, the initial "Redo Size" of 10GB is actually 30GB of Physical Writes to Disk (20GB for Duplexed Online Redo Logs  PLUS 10GB of Archive Logs).

If I had defined an additional ArchiveLogDestination on my server (as I have done in previous implementations where dedicated disks or NFS mount points were assigned), there would have been another 10GB of Physical Writes.

For every Standby Database (note how in previous blog posts here and here , I have demonstrated 3 separate Standby Databases for the Primary Database), 10GB of Redo has to be transferred over the Network and then written to the Standby Redo Logs at each Standby Site/Server.

So, my 10GB of Redo could effectively translate to anywhere from 30GB to 70GB of Physical Write of Redo  Plus 10GB to 30GB of transfer over the network !!

When you look at the SAN or underlying storage, you must consider how all those writes get through.  Does the SAN have enough Write-Through Cache ?  Are those Redo Logs and the one or more ArchiveLogDestination(s) on the Primary Server  actually on separate Disks  -- you might have separate FileSystem MountPoints or ASM DiskGroups but how do they translate down to the Disks in the SAN ?